

Layouts and arrangement
Osintracker offers two automatic node-arrangement algorithms, accessible from the graph toolbar.
Mesh layout (Euler)
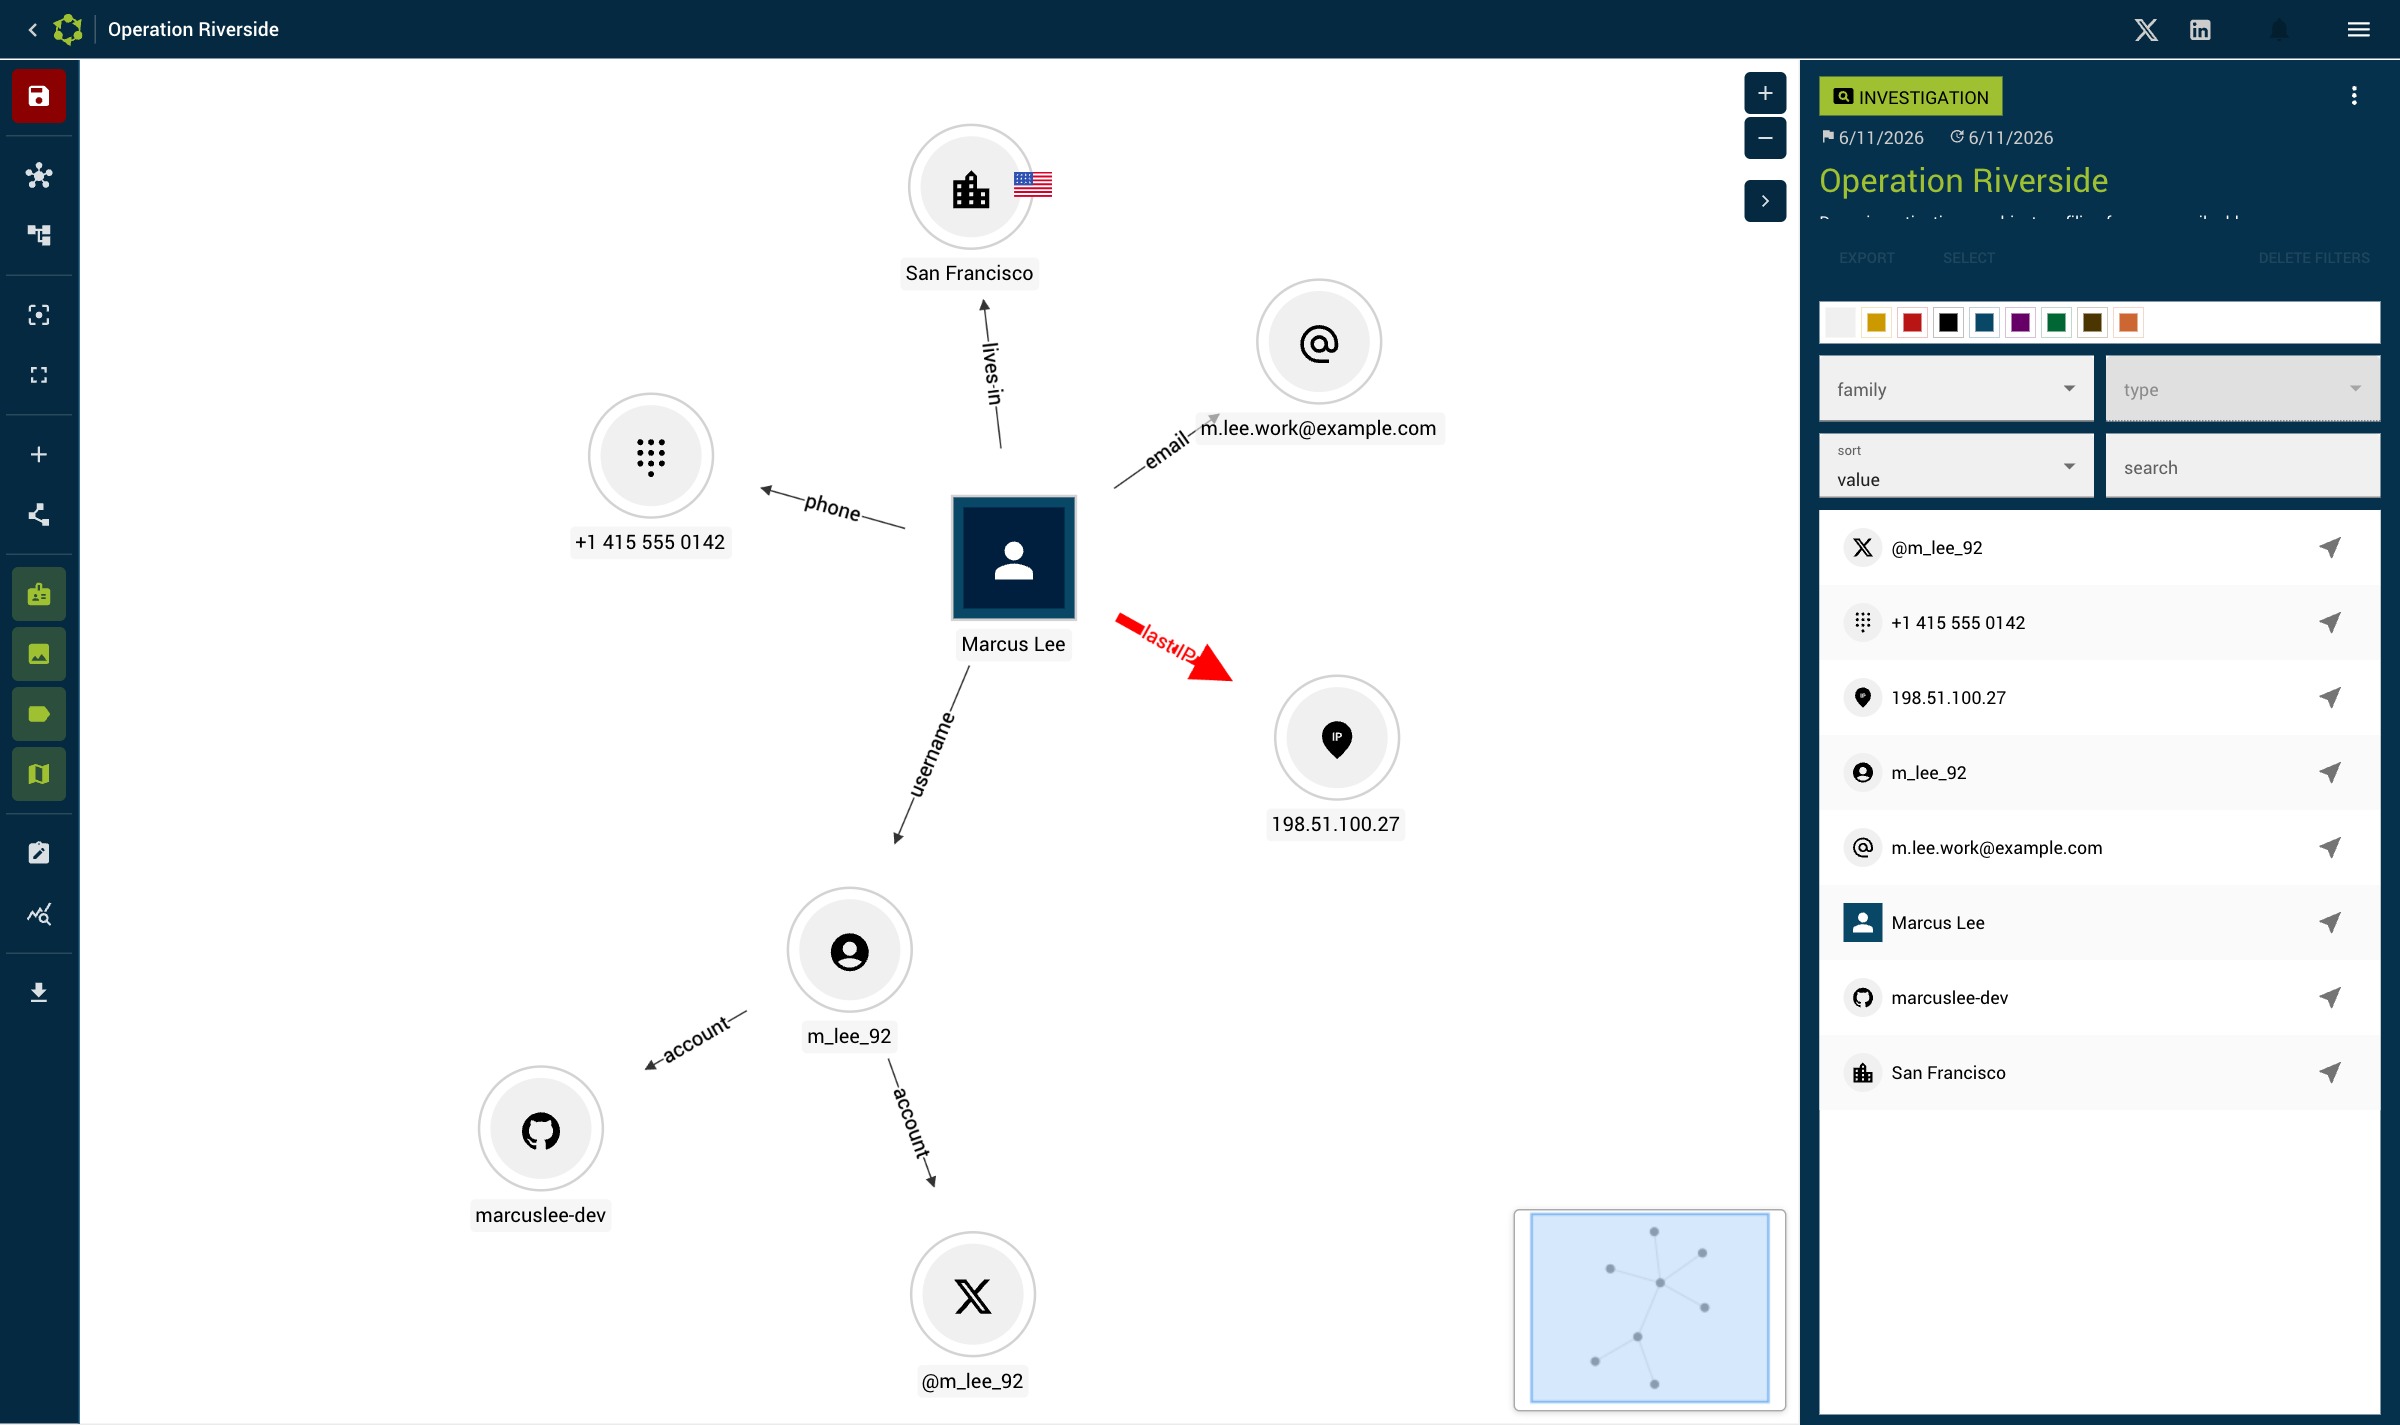
A physics-based algorithm that simulates attraction and repulsion forces between nodes. Ideal for dense graphs where you want a natural, balanced distribution.
Tree layout (Dagre)
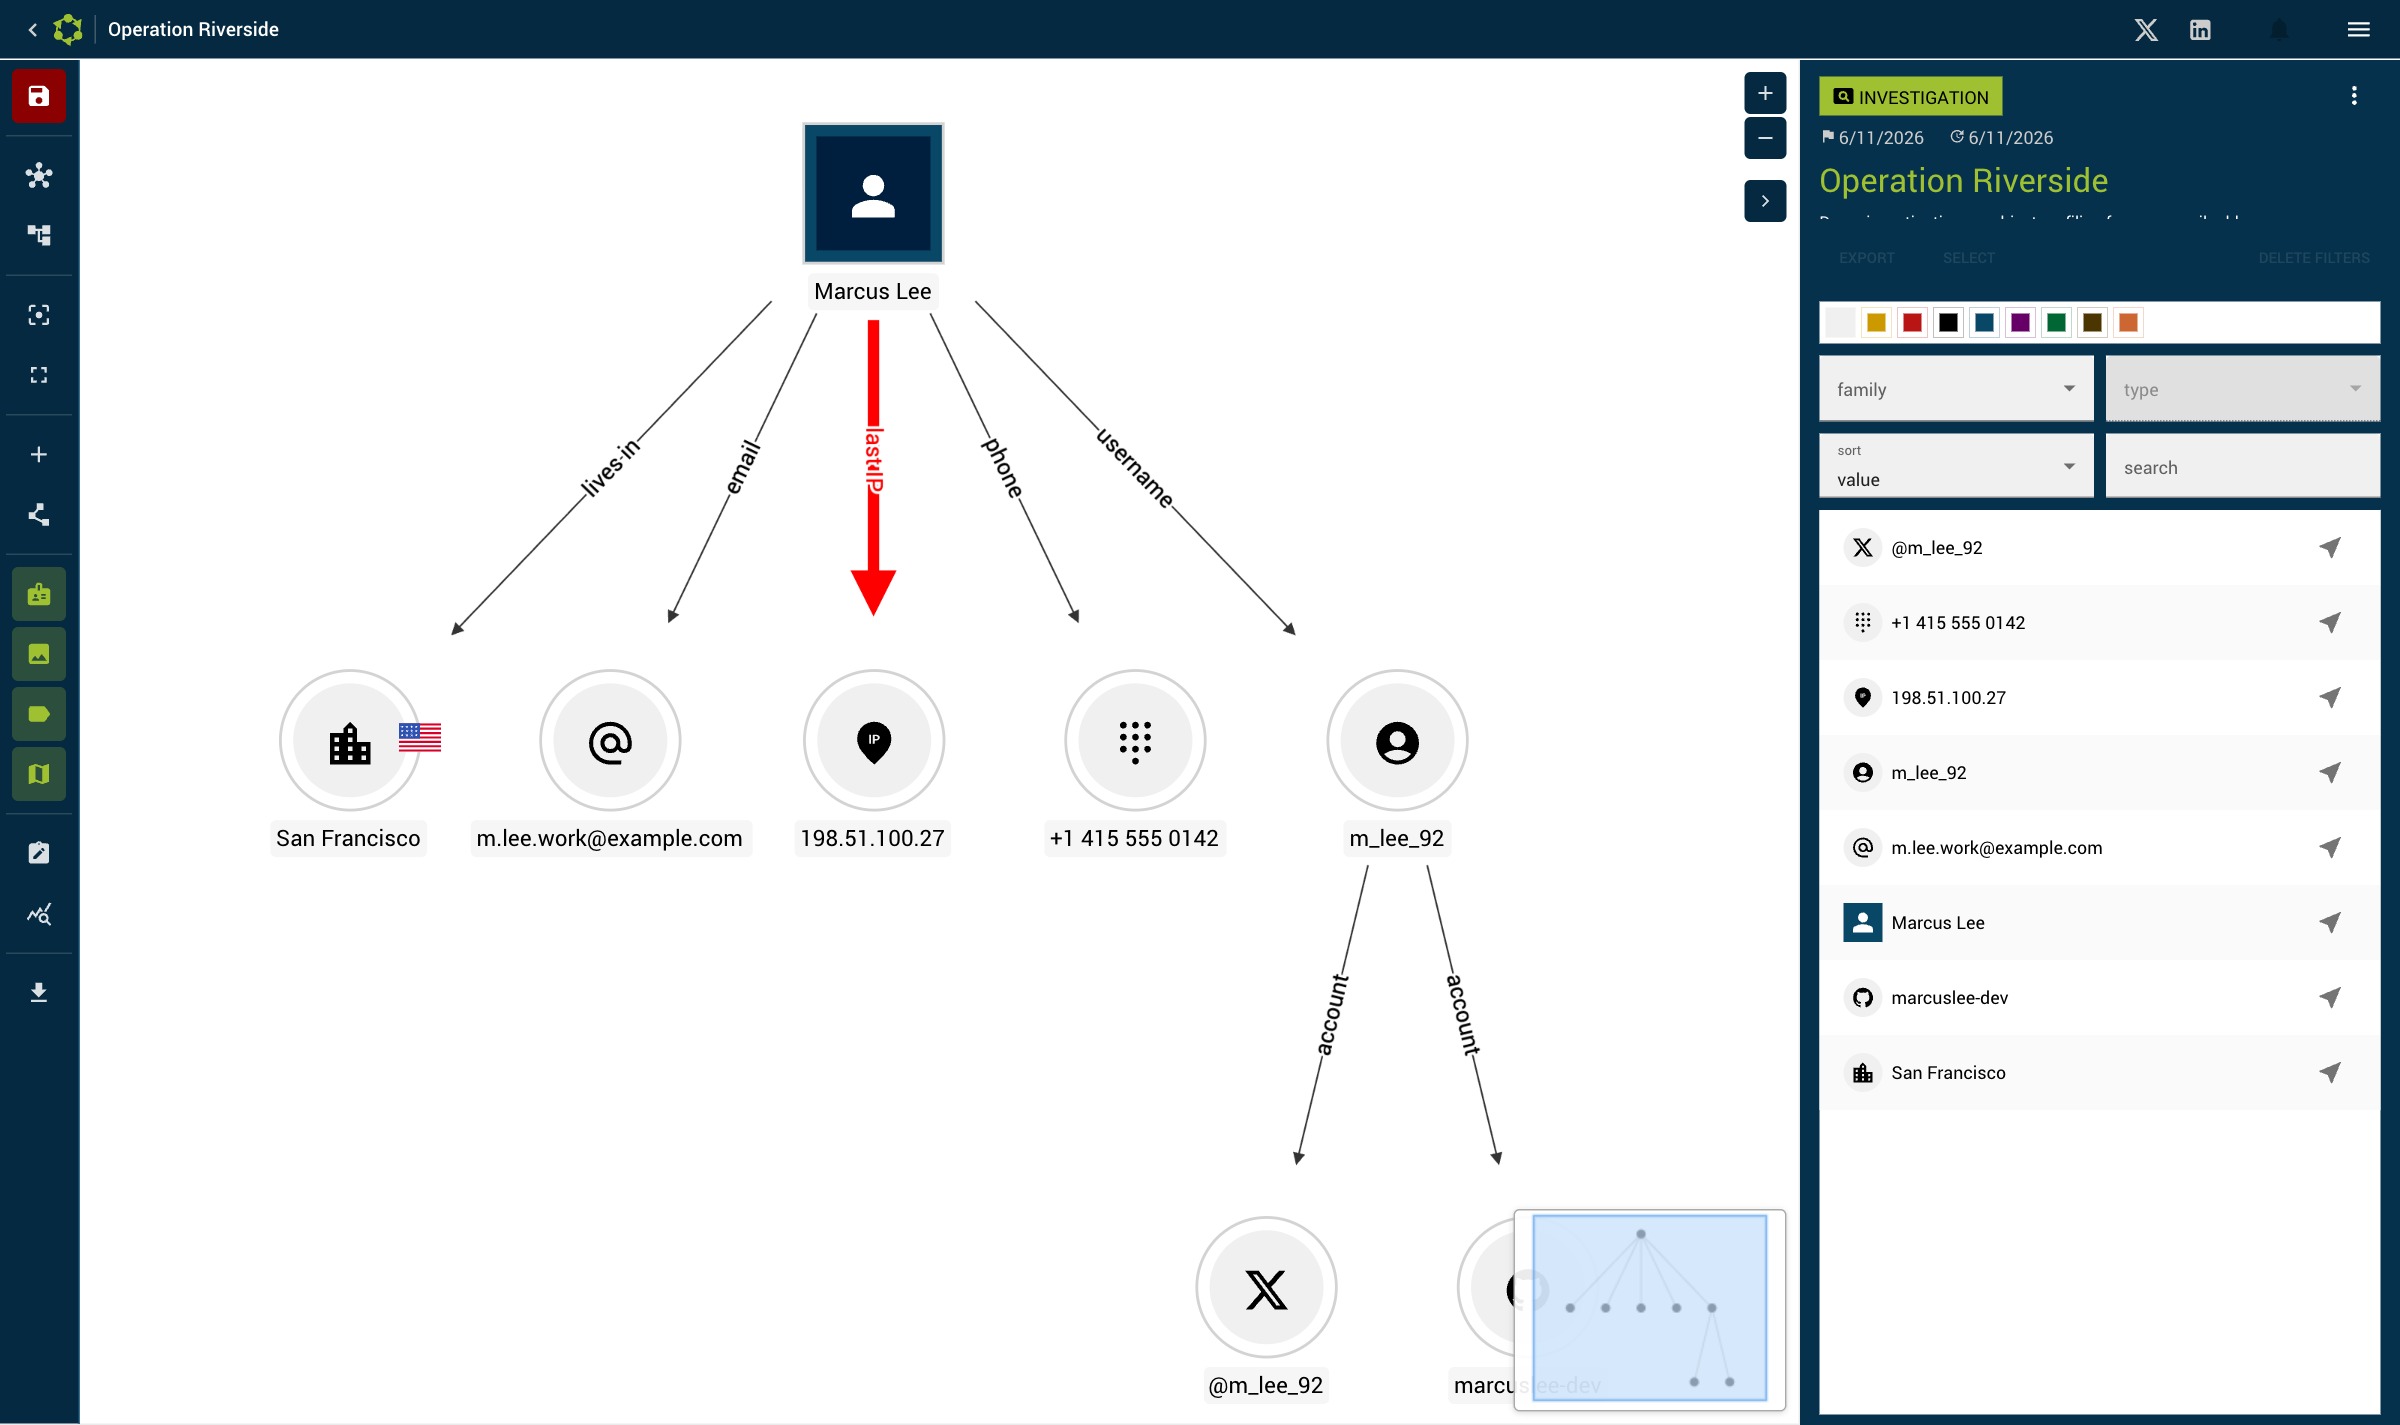
A hierarchical algorithm that organizes nodes into levels. Ideal for graphs with parent/child relationships or clear causal chains.
Choosing the right layout
| Your graph is… | Use |
|---|---|
| A web of peer connections, no clear hierarchy | Mesh — reveals clusters and central nodes |
| A chain of command, ownership or causation | Tree — exposes levels and parent/child links |
| Already arranged the way you want | Neither — just Save positions |
A common workflow is to run Mesh first to let clusters emerge, then switch to Tree if a hierarchy becomes obvious, and finally fine-tune by hand.
Manual fine-tuning
Layouts are a starting point, not the final word. After applying one you can drag individual nodes to:
- pull related entities closer together,
- move a key node to the centre,
- separate overlapping clusters.
Always click Save positions afterwards, otherwise your manual arrangement is lost when you reopen the investigation.
Working with large graphs
Dense investigations can become hard to read. To keep them legible:
- Apply a layout, then Center to fit everything in view.
- Use the toolbar toggles Hide labels, Hide badges and Hide images to cut visual noise — see the graph toolbar.
- Switch to Fullscreen mode for maximum working area.
- Use Critical, Color and Size attributes so important nodes stand out even in a crowded graph.
Save positions
After manually rearranging the nodes (by drag & drop) or applying a layout, click Save positions to store the positions in the database. They will be restored the next time you open the investigation.
Center the view
The Center button recenters the view on the whole graph, regardless of the current zoom level.
Zoom
Use the scroll wheel to zoom in and out. Panning (moving the view) is done by dragging on the graph background.