

Navigating and interacting with the graph
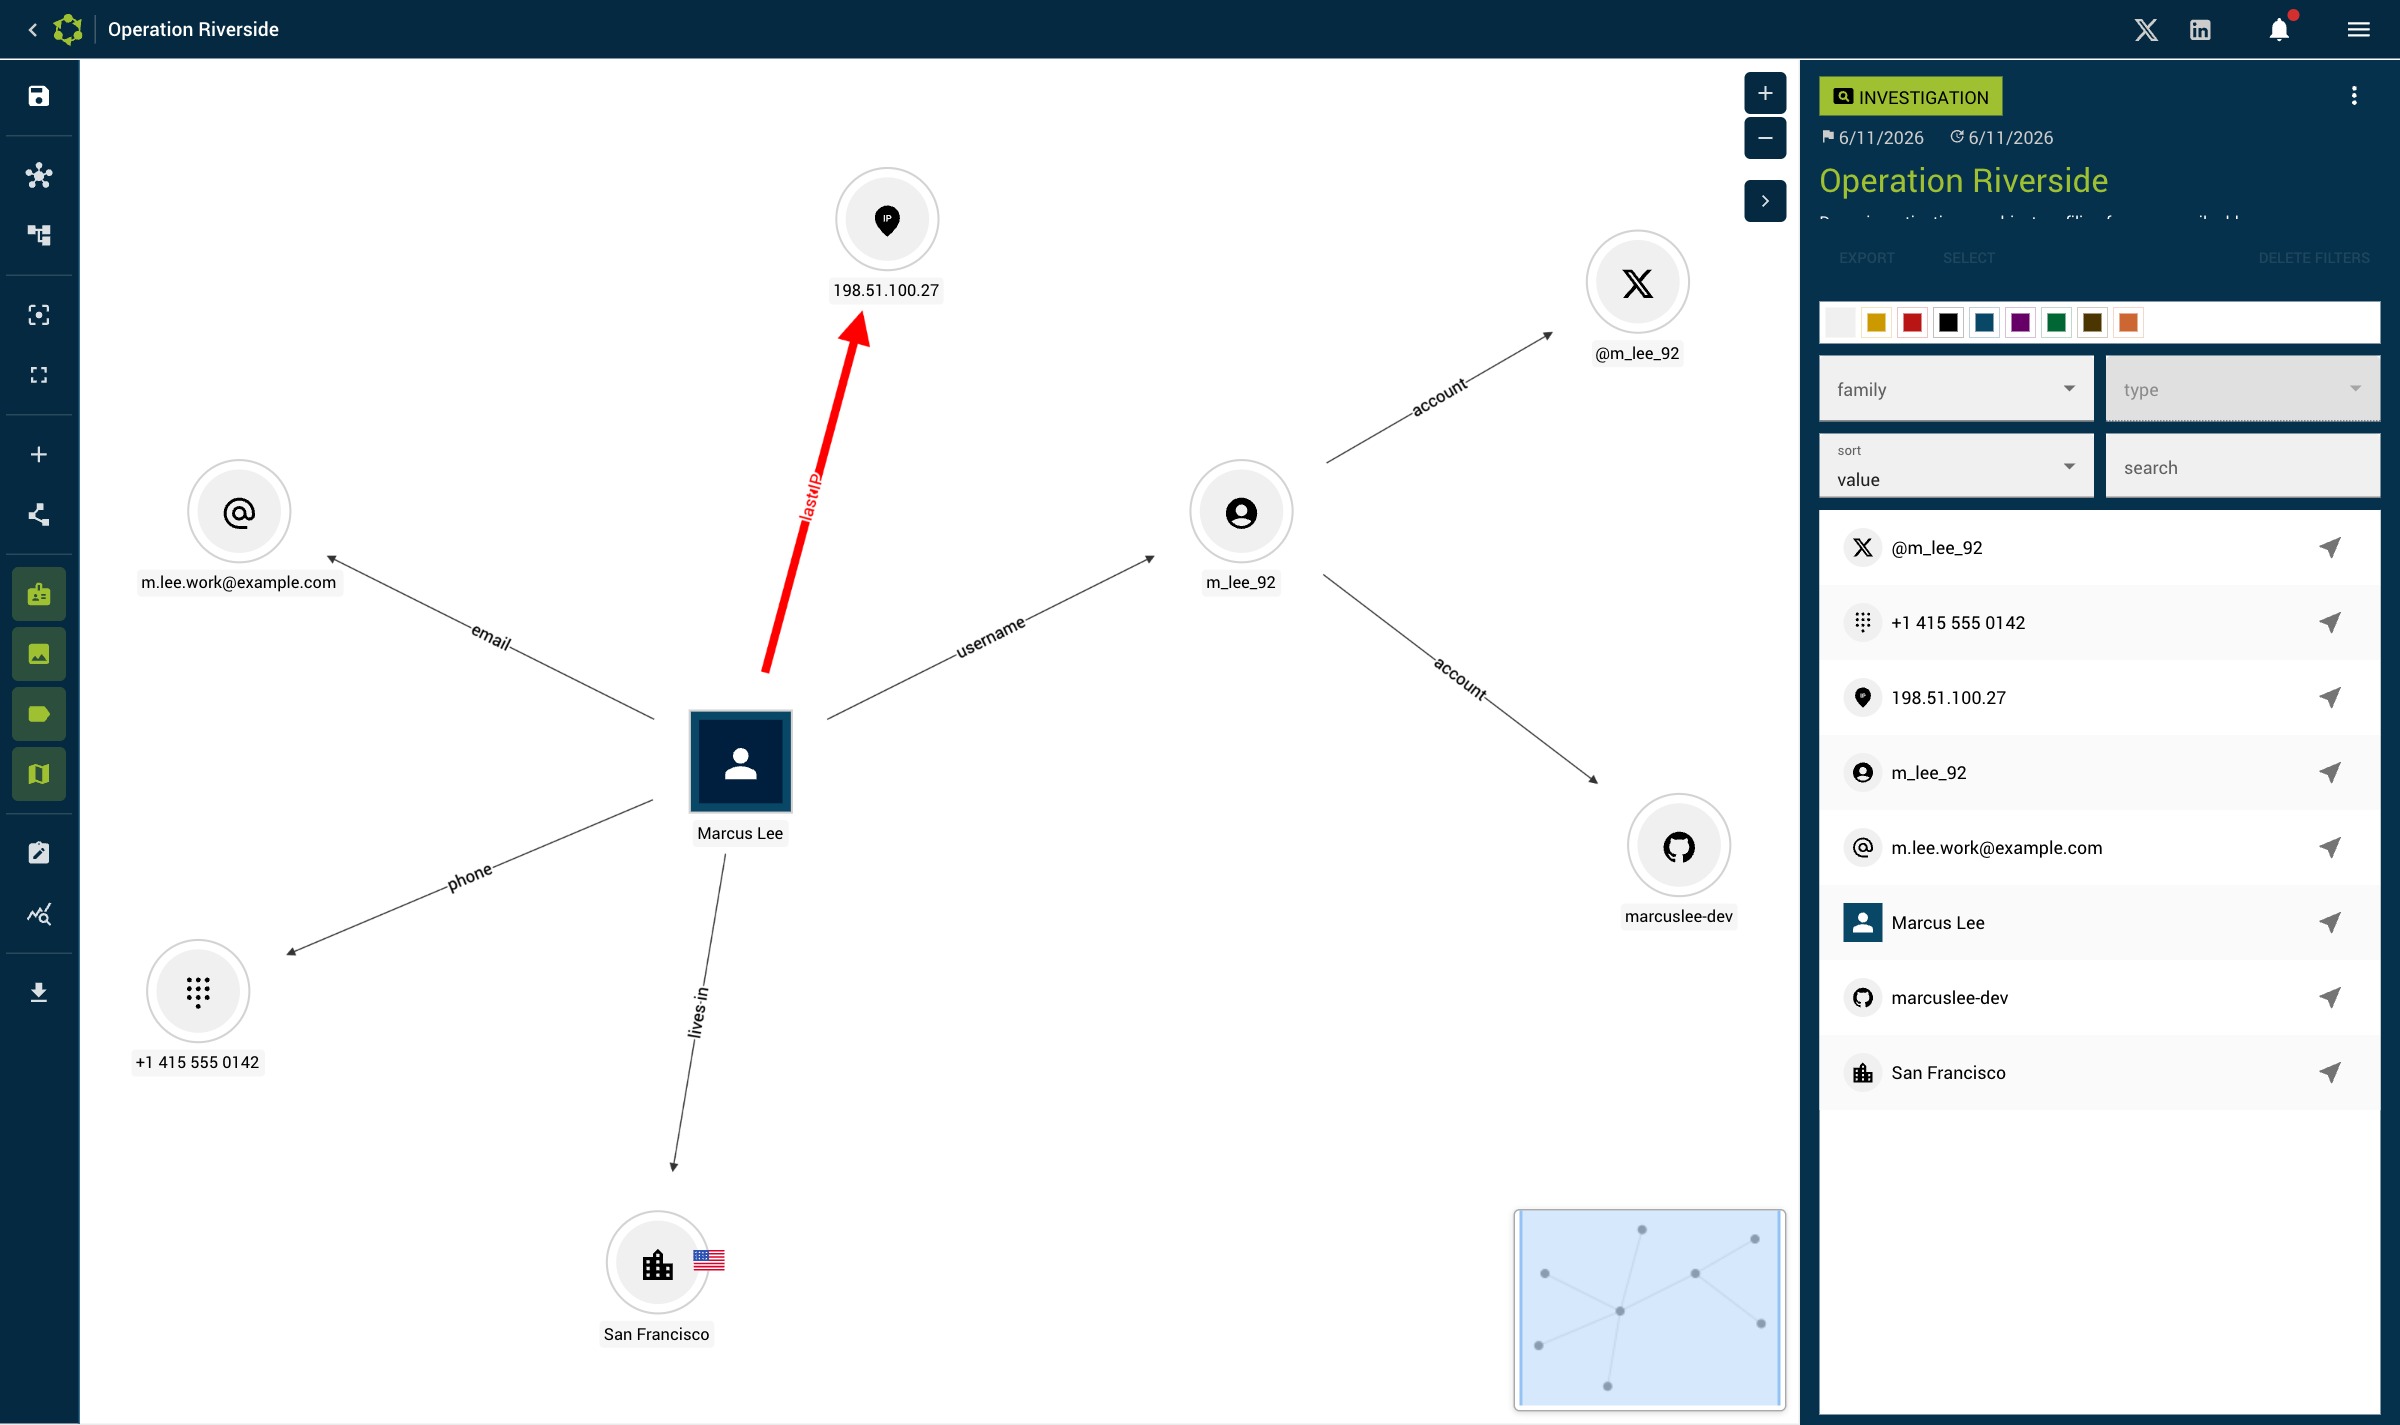
The graph is an interactive node-link diagram powered by Cytoscape.js, displayed on a dark background.
Basic interactions
Selection
| Action | Result |
|---|---|
| Click on a node | Selects the entity, opens its detail panel |
| Click on an edge | Selects the relationship, opens its detail panel |
| Click on the background | Deselects everything, shows the investigation panel |
Shift + click | Multiple selection |
| Draw a rectangle | Area-based multiple selection |
Navigation
| Action | Result |
|---|---|
| Drag a node | Moves the node |
| Drag the background | Pan (move the view) |
| Scroll wheel | Zoom in / out |
Context menu (right-click on a node)
- ★ Favorite: mark / unmark the entity as a favorite
- Duplicate: creates a copy of the entity
- Delete: opens the deletion confirmation
- Color: 8 available colors
- Badge: 6 progress badges (Done, Exclamation, False positive, Question, Stop, Pending)
- Size: S (small), M (medium), L (large)
- Osint Industries — JSON import: import OSINT Industries JSON results onto this entity
Graph toolbar
| Button | Shortcut | Function |
|---|---|---|
| Save positions | — | Saves the positions of all nodes |
| Mesh layout | — | Physics-based algorithm (Euler) |
| Tree layout | — | Hierarchical algorithm (Dagre) |
| Center | — | Recenters the view on the whole graph |
| Add entity | — | Opens the entity creation dialog |
| Add multiple entities | — | Bulk-creates entities from a pasted list |
| Fullscreen | — | Switches the graph to fullscreen mode |
| Hide badges | — | Shows/hides progress badges |
| Hide images | — | Shows/hides node images |
| Hide labels | — | Shows/hides node and edge labels |
Legends
Two legends are shown on the graph:
- Color legend (top): labels of the custom colors defined in the investigation (up to 8)
- Family legend (bottom): entity type families with their color code
Fullscreen mode
The fullscreen button in the toolbar expands the graph to the full screen for better visibility during complex analyses.